Relogic Medical Research Practice

Medical evidence with epidemiological depth.

Our research consultancy frames medical and public-health questions, structures epidemiological evidence, and communicates findings through clear study narratives and graph-led outputs. The portfolio below is designed for five consultancy-led studies, with each visual area ready for the final graph or figure from that study.

Medical Epidemiology / 01

Five studies presented through the evidence they produced.

Each case is written as a consultancy-led medical or epidemiological research showcase. Replace the illustrative SVG in each image slot with the actual graph, forest plot, trend figure, map, survival curve, or study visualization you want to publish.

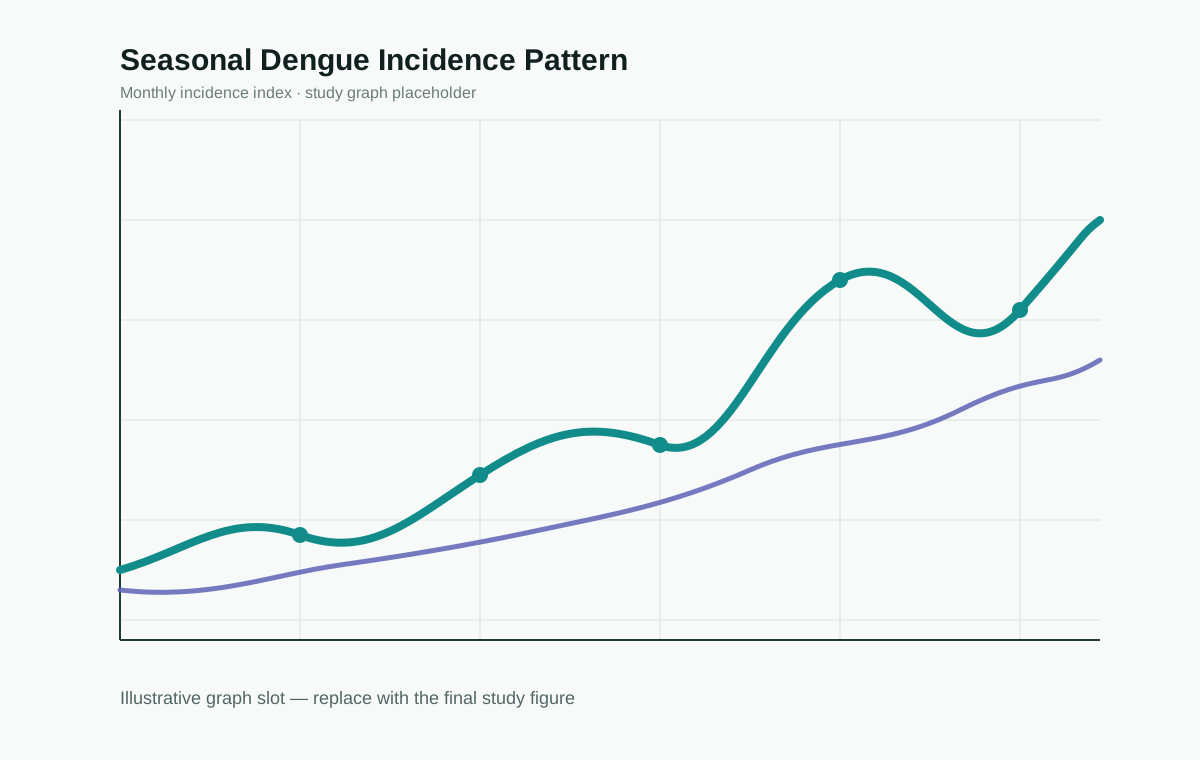
Graph placeholder for the dengue incidence and seasonality studyStudy graph · replace with final figure
01
Consultancy-led epidemiological study

Urban Dengue Incidence & Seasonal Transmission Study

A population-level epidemiological investigation examining how dengue incidence changes across seasons, locations and transmission periods. The study showcase can present incidence curves, epidemic peaks, spatial clusters or intervention-period comparisons from the final analysis.
DengueIncidenceSeasonalitySurveillance
Medical epidemiology · Infectious diseaseDiscuss a study ↗
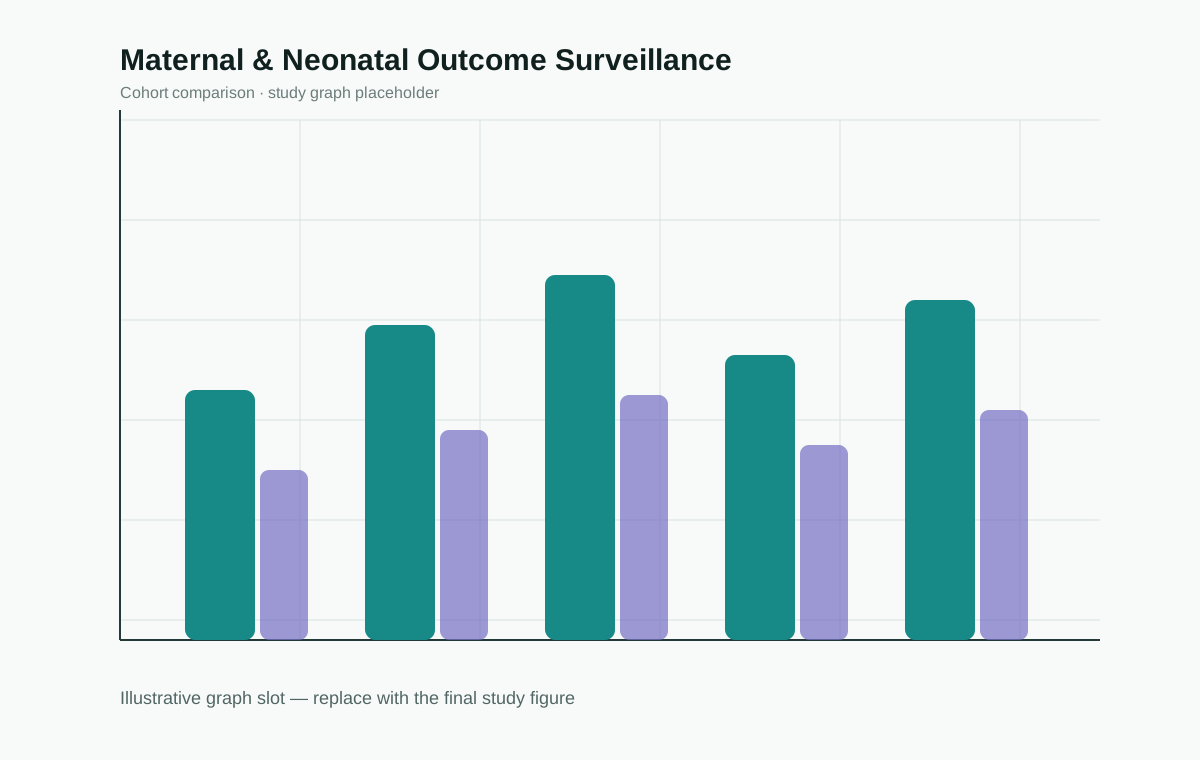
Graph placeholder for the maternal and neonatal outcome surveillance studyStudy graph · replace with final figure
02
Consultancy-led clinical epidemiology study

Maternal & Neonatal Outcome Surveillance

A clinical-epidemiological study structure for examining maternal characteristics, delivery pathways and neonatal outcomes across defined cohorts. The final graph area can be used for outcome comparisons, risk ratios, confidence intervals, temporal trends or facility-level surveillance results.

Maternal HealthNeonatal OutcomesCohort AnalysisRisk Factors
Clinical epidemiology · Maternal & child healthDiscuss a study ↗
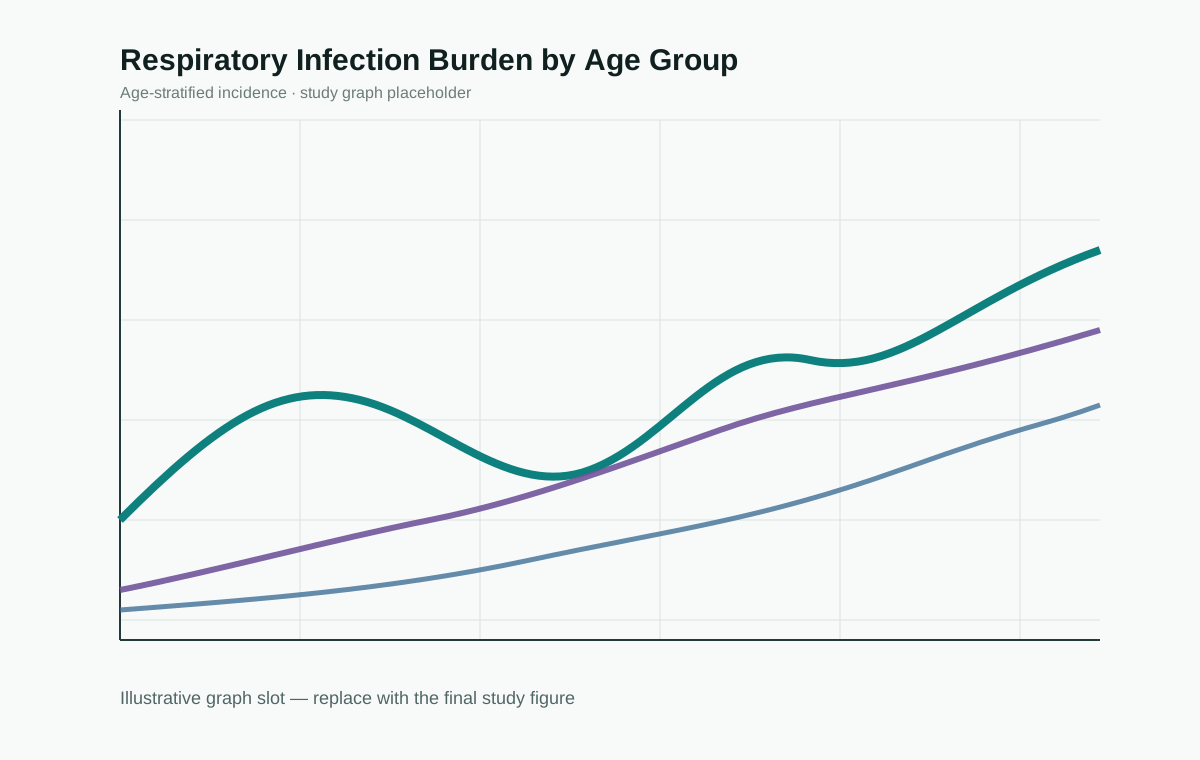
Graph placeholder for the respiratory infection age-specific burden studyStudy graph · replace with final figure
03
Consultancy-led population health study

Respiratory Infection Burden & Age-Specific Risk

An epidemiological assessment designed to compare respiratory infection burden across age groups and clinical risk profiles. The study visualization can feature age-stratified incidence, hospitalization trends, seasonal variation or adjusted risk estimates from the final dataset.

Respiratory DiseaseAge StratificationDisease BurdenRisk Modelling
Population health · Respiratory epidemiologyDiscuss a study ↗
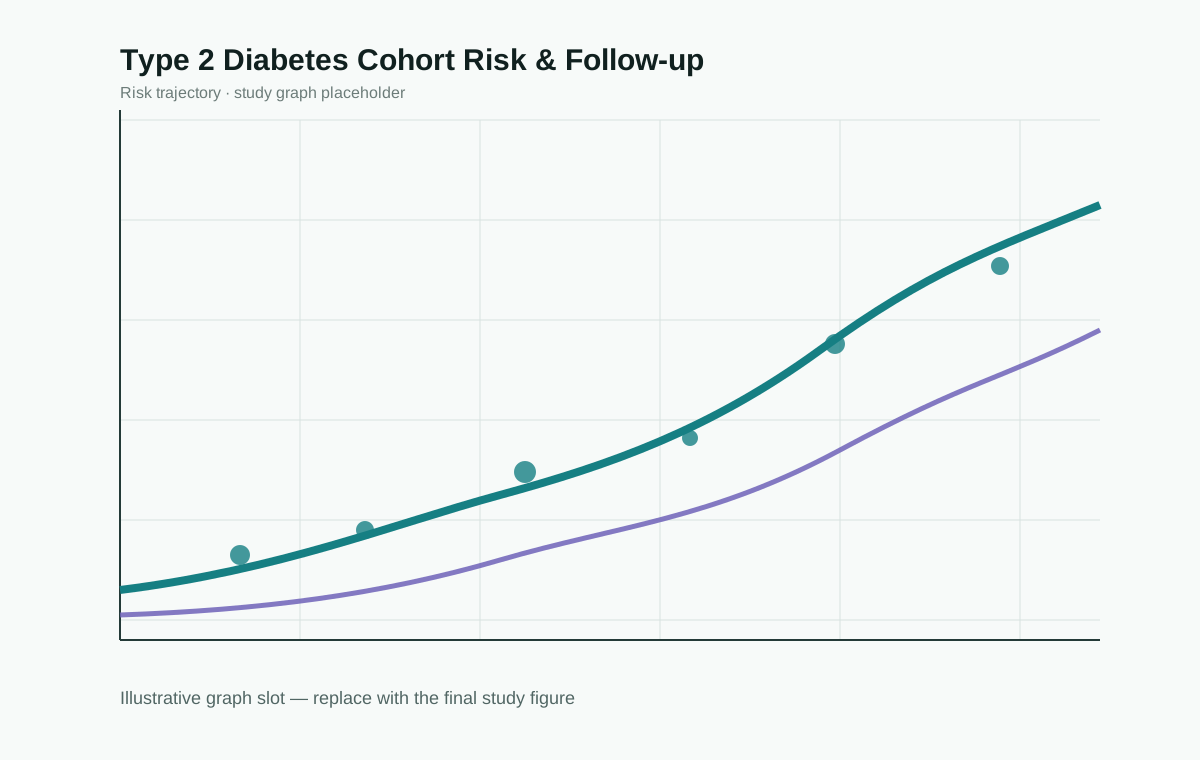
Graph placeholder for the type 2 diabetes cohort risk studyStudy graph · replace with final figure
04
Consultancy-led chronic disease study

Type 2 Diabetes Cohort Risk & Follow-up Analysis

A longitudinal epidemiological framework for examining risk-factor patterns, disease progression and follow-up outcomes among people with type 2 diabetes. This graph slot can present cohort trajectories, adjusted associations, survival-type curves or subgroup comparisons from the completed study.

DiabetesLongitudinal CohortRisk FactorsOutcome Analysis
Chronic disease epidemiology · Cohort researchDiscuss a study ↗
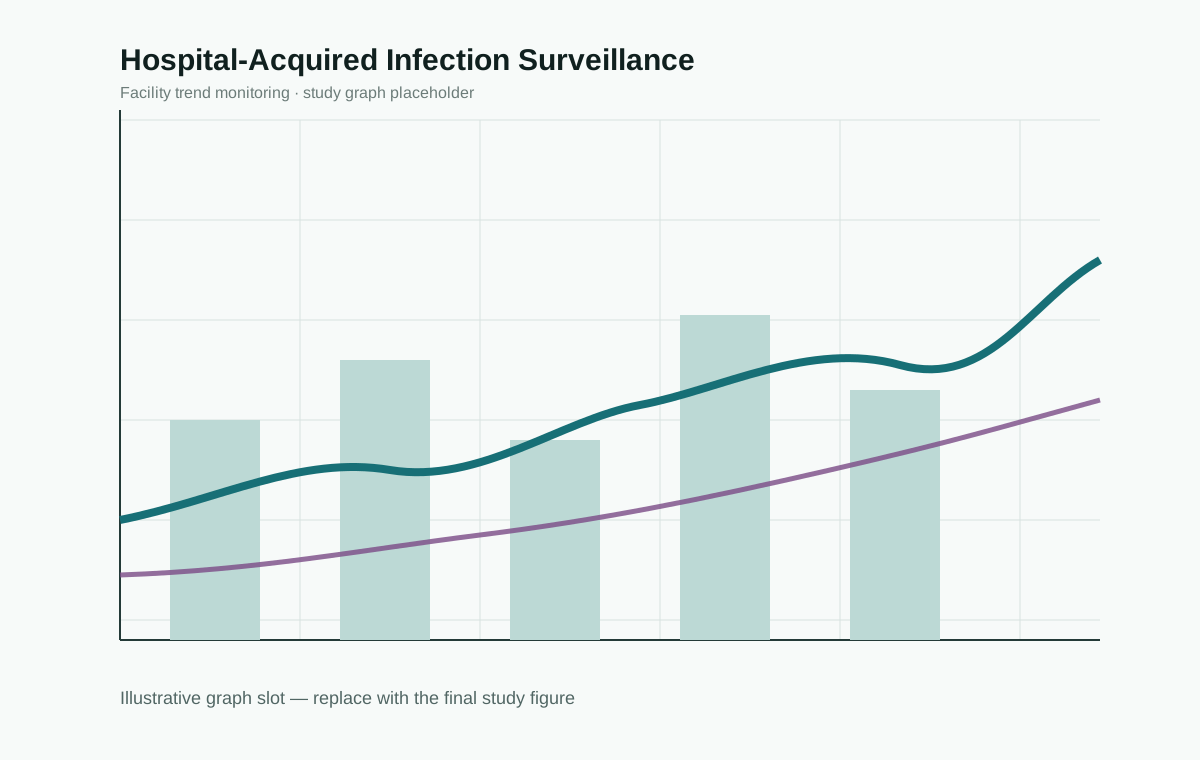
Graph placeholder for the hospital-acquired infection surveillance studyStudy graph · replace with final figure
05
Consultancy-led hospital epidemiology study

Hospital-Acquired Infection Surveillance & Resistance Trends

A hospital-epidemiology study focused on infection events, patient exposure patterns and surveillance trends across clinical settings. The final figure can showcase incidence density, organism distribution, resistance patterns, ward-level trends or pre/post infection-control comparisons.

HAIHospital EpidemiologyAMRInfection Control
Hospital epidemiology · Infection surveillanceDiscuss a study ↗
Epidemiology Model / 02

From clinical question to interpretable population evidence.

The research pathway is built for medical and epidemiological work: define the study population, structure exposure and outcome variables, select an appropriate analytical design, and translate uncertainty into a figure and narrative that decision-makers can understand.

01Define population, exposure, comparator and outcome.
02Build the study dataset and epidemiological variable model.
03Estimate associations, uncertainty and potential bias.
04Translate findings into graphs, interpretation and recommendations.
Epidemiology
Study System
PopulationExposureOutcomeInference

Research designed to survive epidemiological scrutiny.

Each engagement moves from a precise clinical or public-health question to a reproducible analysis and a graph-led final narrative, with limitations and uncertainty communicated alongside the result.

01 / FRAME

Study question

Clarify population, setting, exposure, comparator, outcome and the decision the research should support.

02 / DESIGN

Epidemiological design

Select the appropriate cohort, cross-sectional, case-control, surveillance or other analytical structure.

03 / ANALYSE

Risk & uncertainty

Estimate associations, trends and uncertainty while considering confounding, bias and data quality.

04 / COMMUNICATE

Graph-led evidence

Turn the final analysis into interpretable figures, study narratives and decision-ready research outputs.

Bring us the medical question that needs a defensible study.

Start a Research Engagement →